Stop over-reporting. Calculate Scope 2 emissions accurately.

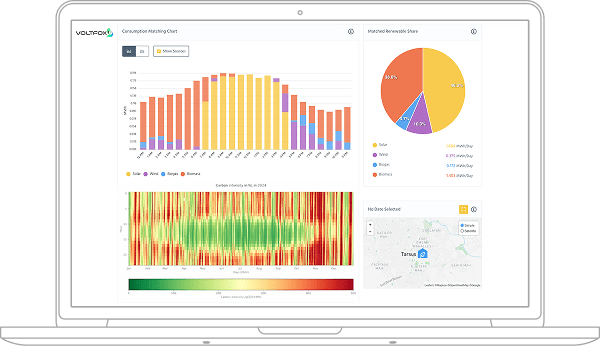
Voltfox automates hourly, location-based Scope 2 accounting and verified 24/7 green energy matching. Move beyond annual averages and stay audit-ready.

Methodology verified by: QSI Logo

Reported Emission Reduction

25% ↓ YoY

Accurate Emission Calculation

Replace annual averages with hour-by-hour, grid-specific factors tied to your actual consumption times and locations. Voltfox delivers defendable Scope 2 figures, highlights true hotspots and savings opportunities, and produces audit-ready outputs for disclosures and internal reporting. In Alignment with: GHG Protocol (Scope 2) and ISO 14064-1:201

24/7 Carbon-Free Energy Matching

Match every hour of your electricity use with verified carbon-free supply from your PPAs, onsite generation, and energy certificates. Voltfox automates certificate tracking and retirement, shows hourly coverage and gaps, and provides shareable proof of clean energy on every report.

Verified impact for
accurate Scope 2
More than
0
Companies
analyzed
More than
0
Facilities
covered
More than
0 ktCO₂e
Reported emissions
reduced
Up to
0 %
Over-reporting
eliminated
Verified Methodology

Independent and Reliable

Voltfox’s electricity emission factor calculation methodology has been reviewed and verified by QSI Certification & Inspection based on ISO 14064-1 and the GHG Protocol requirements.

With this statement dated 21.11.2025, Voltfox outputs provide an audit-ready foundation for calculations under ISO 14064-1.

QSI Certification Document

From Raw Data to Verifiable Impact.

A streamlined, automated workflow to transform your messy utility data into audit-ready 24/7 carbon reports.

1

Connect Data

Seamlessly ingest meter, generation, and operational data via CSV upload or direct API integration.

2

Recalculate Hourly

We apply granular, location-specific grid emission factors to calculate your true carbon footprint.

3

Match 24/7 Optional

Align consumption with clean energy generation in real-time and automate certificate retirement.

4

Report & Verify

Export audit-ready reports and visualize progress on public or private dashboards.

↓ 35%

Decrease in reported emissions

(case-dependent)

170+

Regions with granular coverage

(60+ countries)

Zero

Registry accounts you need

(Voltfox executes retirements)

Proof, Not Promises

Accuracy First

Hourly grid factors; defendable, location-based math that stands up to scrutiny.

24/7-Ready

A simple path from "recalculate" to "match" and retire, without the registry overhead.

Global Applicability

We cover 230+ regions in 190+ countries, with more added continuously.

Clarity for Stakeholders

Report-ready Scope 2 and energy-mix transparency, even at the bill-level.

Aligned with modern guidance like 24/7 CFE and the upcoming GHG accounting practices.

Stop reporting emissions you may not have caused.

Annual emission factors treat every hour of electricity consumption as if it had the same carbon impact. In reality, grid intensity changes throughout the day as renewable generation, demand, and fossil generation shift.

Voltfox replaces broad yearly assumptions with hourly energy and emissions data, helping companies calculate a more accurate Scope 2 footprint and avoid unnecessary over-reporting when annual averages do not reflect their actual consumption profile.

From annual estimate to hourly evidence

Example
Yearly factor method Broad estimate

420 tCO₂e

1,000 MWh × annual average grid factor of 0.42 tCO₂e/MWh

Voltfox hourly method Evidence-based calculation

355 tCO₂e

Each hour of consumption × the emissions factor for that specific hour

Potential over-reporting avoided in this example 65 tCO₂e

This example is illustrative. Hourly calculations do not always produce a lower number, but they produce a more accurate number by reflecting when electricity was actually consumed.

Aligned With Global Standards

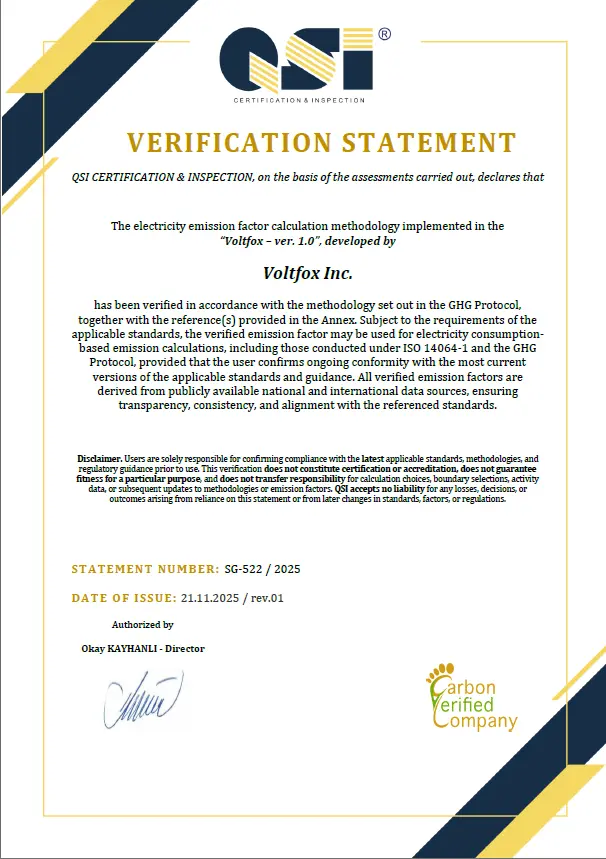
Our methodology aligns with the world’s most advanced standards for credibility and transparency.

UN 24/7 CFE Logo GHG Protocol Logo I-Track Logo CDP Logo SBTi Logo
Case Study

From Average to Accurate: -25% in One Region

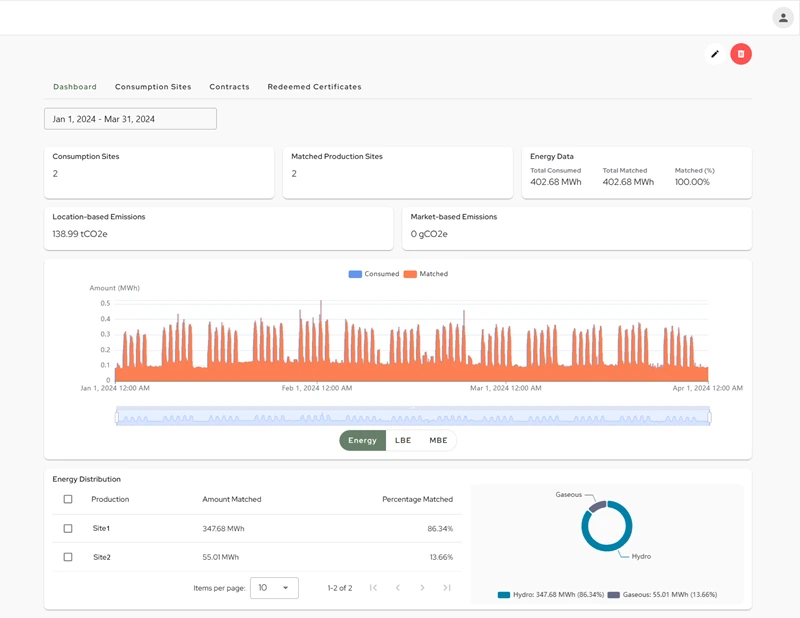
A global manufacturer discovered their reported Scope 2 was ~25% too high when annual averages were replaced with hourly, grid-specific factors mapped to their consumption times.

More precise data provides not only compliance but also competitive advantage.

Chart showing a 25% reduction in emissions

Ready to report what’s real?

Stop assuming. Start calculating. Get the defendable, hourly data you need to make smarter decisions and meet compliance head-on.